Single cell references (Brain)#
This example used microarray transcriptomic profiling of 41 patients from different age groups GSE53890.
As references a single cell dataset from 466 cells (GSE67835) published by Darmanis et al., 2015 (Proc Natl Acad Sci).
[8]:
import anndata
import seaborn as sns
import matplotlib.pyplot as plt
import dtangle
[2]:
# Load dataset
adata_mix = anndata.read_h5ad("../../examples/data/brain_aging_microarray.h5ad")
adata_ref = anndata.read_h5ad("../../examples/data/brain_single_cell.h5ad")
adata_mix.var_names_make_unique()
adata_ref.var_names_make_unique()
/home/malte/Dokumente/Github/dtangle/.venv/lib/python3.11/site-packages/anndata/_core/anndata.py:1825: UserWarning: Variable names are not unique. To make them unique, call `.var_names_make_unique`.
  utils.warn_names_duplicates("var")
Run deconvolution from single cell reference
[4]:
dtangle.deconvolut(
    adata_mix,
    references=adata_ref,
    reference_annotation_col="cell_type",
    data_type="microarray-gene",
)
[5]:
adata_mix.obsm["dtangle"].head()
[5]:
| Oligodendrocyte precursor cells | Neurons | Neuroblast | Astrocytes | Oligodendrocytes | Microglia | |
|---|---|---|---|---|---|---|
| GSM1303144_24M.CEL | 0.130750 | 0.385471 | 0.157636 | 0.128135 | 0.087965 | 0.110044 |
| GSM1303145_25BF.CEL | 0.134050 | 0.373632 | 0.158939 | 0.135272 | 0.088278 | 0.109829 |
| GSM1303146_25F.CEL | 0.131120 | 0.372604 | 0.154251 | 0.146045 | 0.091005 | 0.104975 |
| GSM1303147_26BM.CEL | 0.129604 | 0.356444 | 0.152652 | 0.157790 | 0.091801 | 0.111709 |
| GSM1303148_26M.CEL | 0.129315 | 0.357495 | 0.153784 | 0.141635 | 0.101902 | 0.115869 |
[6]:
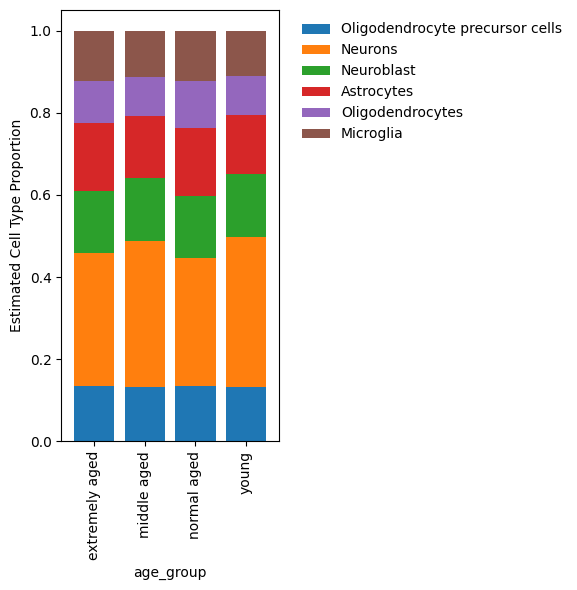
proportions = adata_mix.obsm["dtangle"].copy()
proportions["age_group"] = adata_mix.obs["age_group"].values
proportions = proportions.groupby("age_group", observed=True).mean()
proportions.plot(kind="bar", stacked=True, figsize=(6, 6), width=0.8)
plt.ylabel("Estimated Cell Type Proportion")
plt.legend(bbox_to_anchor=(1.05, 1), loc="upper left", frameon=False)
plt.tight_layout()
plt.show()
[20]:
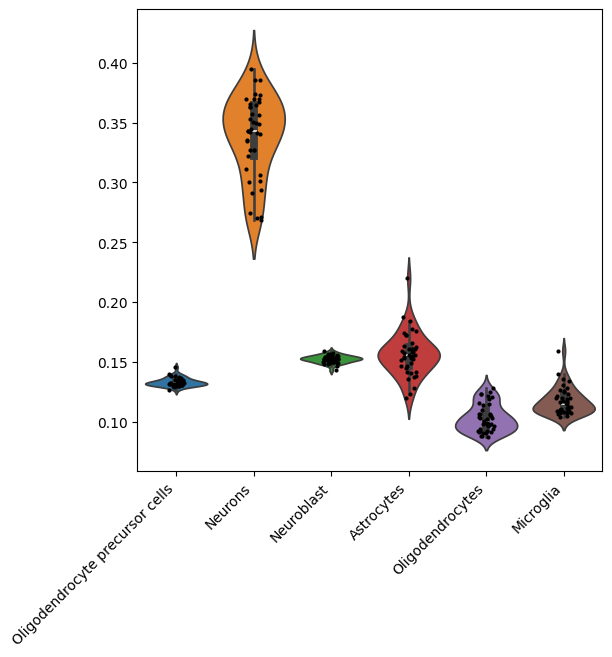
fig, ax = plt.subplots(figsize=(6, 6))
sns.violinplot(adata_mix.obsm["dtangle"], ax=ax)
sns.stripplot(adata_mix.obsm["dtangle"], color="k", size=3, ax=ax)
ax.set_xticks(ax.get_xticks())
_ = ax.set_xticklabels(ax.get_xticklabels(), rotation=45, ha="right")
[51]:
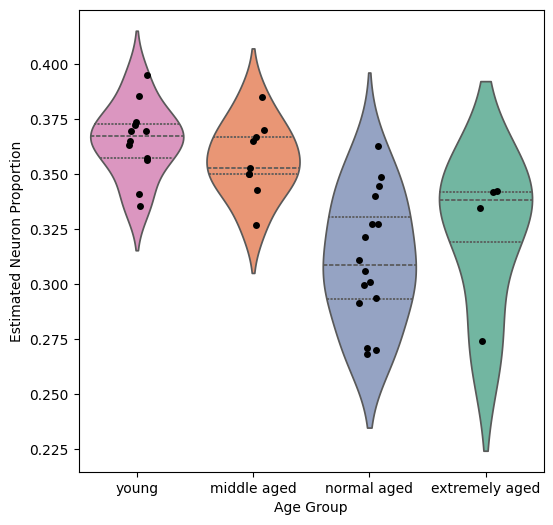
merge_df = adata_mix.obsm["dtangle"].merge(adata_mix.obs["age_group"], left_index=True, right_index=True)
fig, ax = plt.subplots(figsize=(6, 6))
sns.violinplot(
    x="age_group",
    y="Neurons",
    data=merge_df,
    order=[
        "young",
        "middle aged",
        "normal aged",
        "extremely aged",
    ],
    inner="quart",
    hue="age_group",
    ax=ax,
    palette="Set2",
)
sns.stripplot(
    x="age_group",
    y="Neurons",
    data=merge_df,
    order=[
        "young",
        "middle aged",
        "normal aged",
        "extremely aged",
    ],
    color="k",
    ax=ax,
)
ax.set_xlabel("Age Group")
ax.set_ylabel("Estimated Neuron Proportion")
[51]:
Text(0, 0.5, 'Estimated Neuron Proportion')